How To Create Performance API Test Using Postman
We are all aware that APIs are becoming increasingly used in software in recent years. High performance of APIs has always been a top priority requirement for development. Assuring that your APIs are compliant with performance requirements is of paramount importance. You do not want your users to wait for loading of the data for a long time. With recommendation of 500ms for API response time it is quite a challenge for development teams to stay below this mark. There are multiple tools and ways how performance can be checked. In this article we will deal with Postman performance testing since this tool is still number one API testing tool.
Performance testing option in Postman
Postman introduced performance testing option within its runner. It can run a multiple types of performance test profiles: Fixed, Ramp Up, Spike and Peak. It is possible to set number of virtual users and test duration. For the last three profiles it is also possible to configure Base Load which is a starting load at the beginning of the test. Data driven testing is also possible. In Postman performance testing you can specify a file with data which can be fed to each of the requests during execution.
Starting the Runner
To start the performance testing in Postman you need to start the runner first. You can do that by clicking on three dotted menu for your collection and selecting option Run Collection. A runner opens up and you can select all the requests in your collection for the test. You can also rearrange them if it is necessary for you to run them in specific order. In the right hand part of the screen you should see two tabs, Functional and Performance. Clicking on Performance tab opens up the setup page where you can choose the correct profile, number of users, test duration, etc.
Test setup
I have chosen Peak profile with base load of 2 users. Load will increase gradually to 7 users, hold the load for the specified time and then decrease the load.
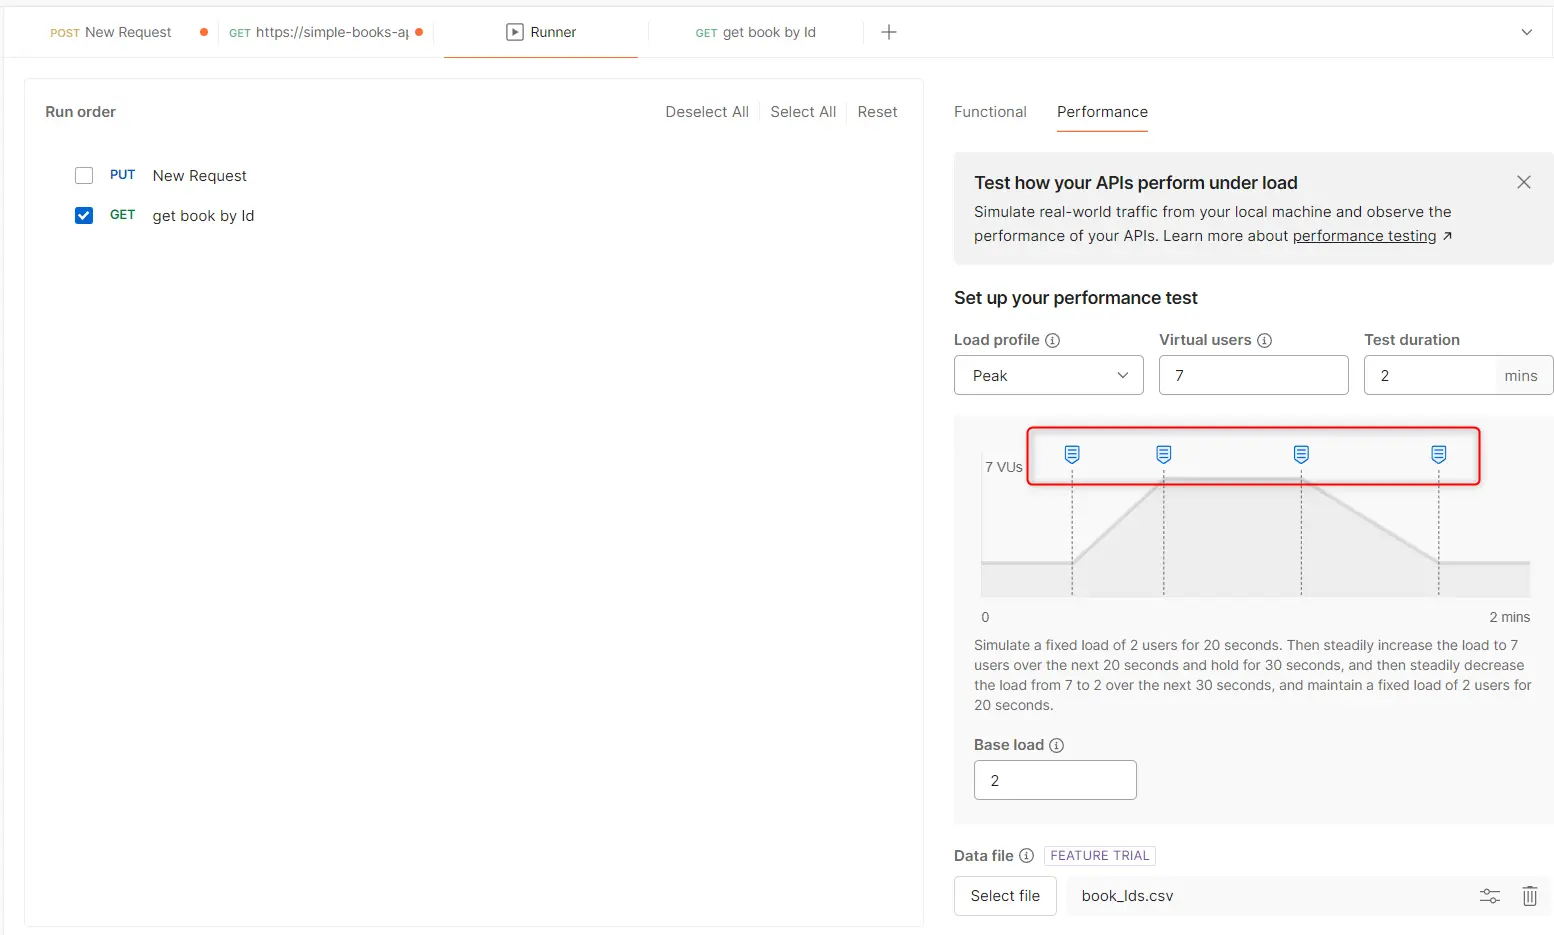
The blue pins highlighted on the picture are draggable and you can change the duration of each phase as you like. You will notice that the text below the picture changes as you drag and drop the pins. The picture and configuration will change for different profiles. In the end I have added a CSV file with a single column named bookId and added 7 IDs from 1 to 7. To map the column values with the request I have created the same variable in Postman request under test. The name of the column in CSV file and the variable must have the same name.
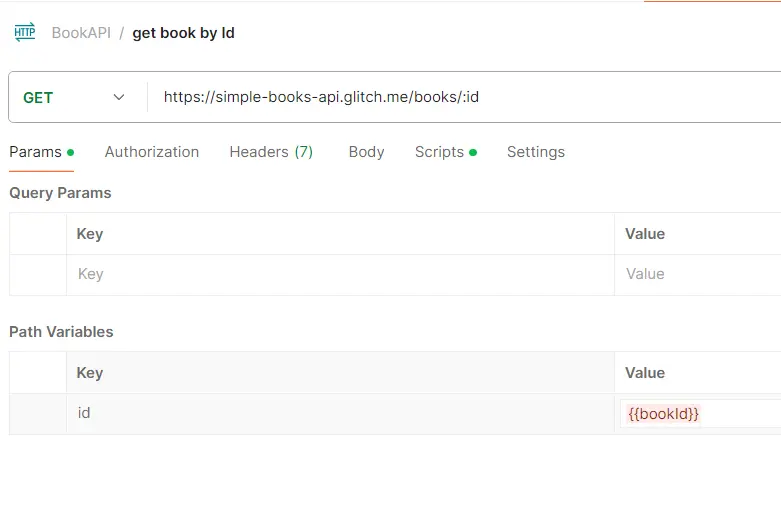
The variable should remain unresolved like on the picture.
Running the test
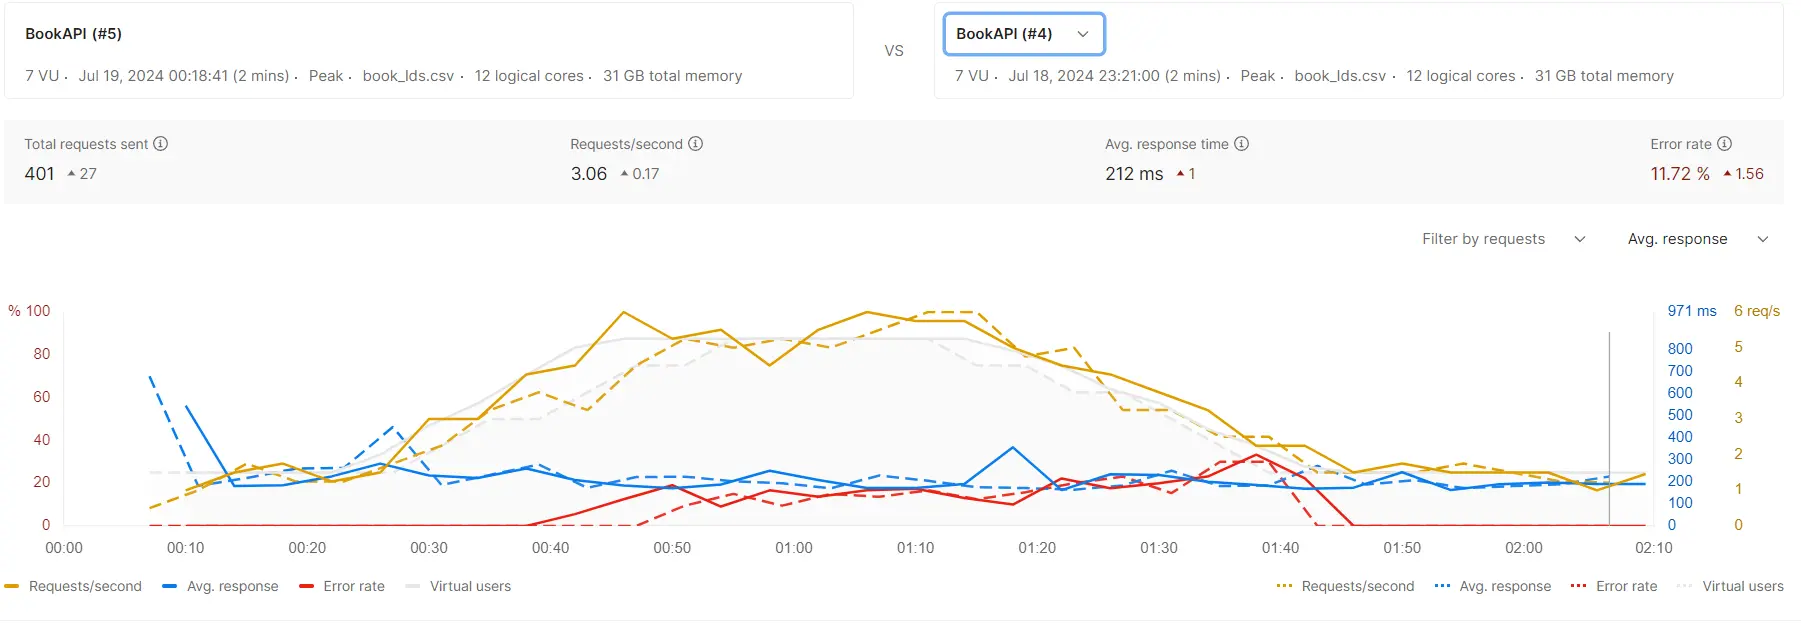
When the setup is ready you can simply click on Run button below the settings. You will see the execution in real time. The graph with four default metrics: Requests/Second, Avg. response, Error rate, Virtual users will be displayed and below you can see all of your request details like average response time, 90th percentile and error rate. Hovering over graph will show some basic details about the requests in that specific period of time.

Results analysis
There are a few interesting features which help with better analysis and presentation of the results. First the graph and results table can be exported in PDF and HTML formats. This can be done from three dotted menu in the top right hand side corner. Another really nice feature is that you can compare results between test runs. This comparison can tell you how your API compares against benchmark values.
The third very useful feature is Error tab where you can see your failed responses, their ratio and error messages.
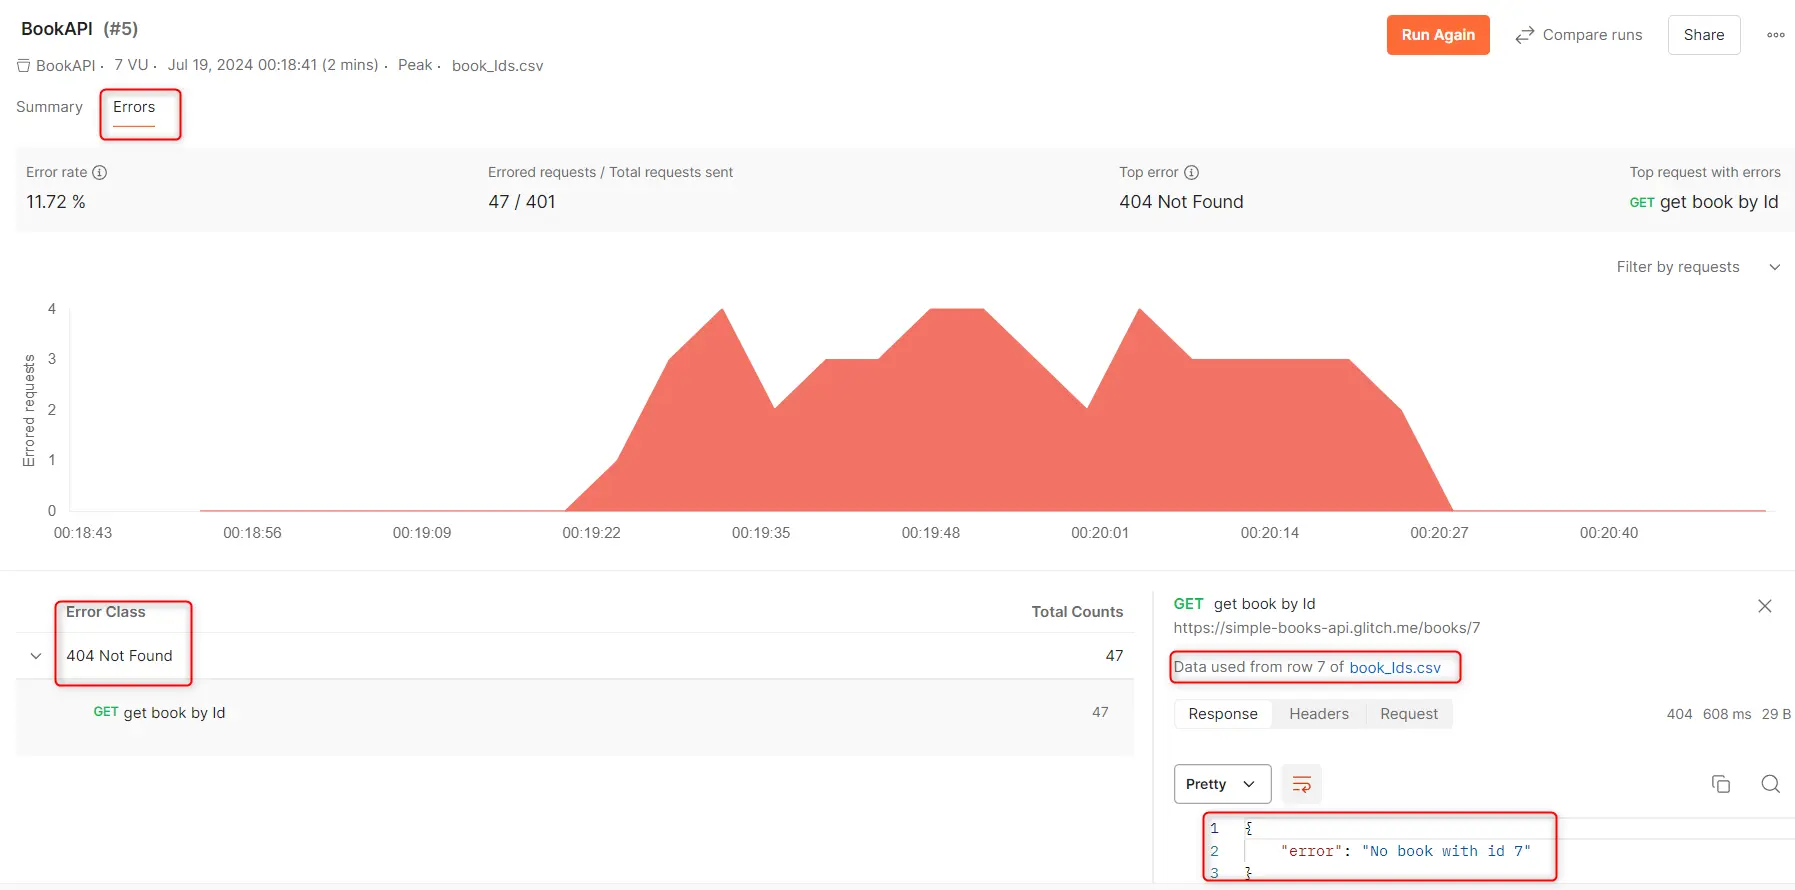
As you can see I made a mistake in the CSV file by adding a book ID with value 7 which does not exist on the server. For that reason I get 404 Not Found message in 47 out of 401 requests.
Case against Postman performance testing
It appears that it is not possible to see the response of the successful requests, if you would like to see some data. Assertions from requests are not taken into consideration. It seems that scripting part doesn’t work and dynamic populating of variables in requests might not work. The test run cannot be automated and scheduled like it is possible with regular API testing.
Conclusion
All in all it appears this is a simple way of performing performance testing for small scale tests. It is useful for developers to run tests during API development. Although you would have to use different tool for some large scale and more in depth tests Postman performance testing is quite easy and clean.