Get The Best Out Of Chrome Dev Tools Elements Panel
Usually when we say Developer Tools most people think about Elements panel. However, there are many useful panels in Dev Tools. We will start these series of articles with Elements as the most used panel. In all honesty, I believe that Elements panel is underutilized having in mind all of the things it can do. Just to mention, this panel is called differently in different browsers. For example in Firefox it is named Inspector, but Safari and Edge also label it as Elements. For purposes of this article we will use Chrome, although the experience is quite similar in other browsers. To cover the basics, there are two ways to open the Developer Tools in browser: by pressing F12 on your keyboard or performing the right click on your mouse and selecting Inspect option.
Inspecting Elements
Chrome Dev Tools Elements panel is all about inspecting elements. In QA we mostly use this panel to find adequate elements for test automation. We either right click on the element and click Inspect or we press F12 and then use the arrow button in top left hand side corner to start inspection tool.
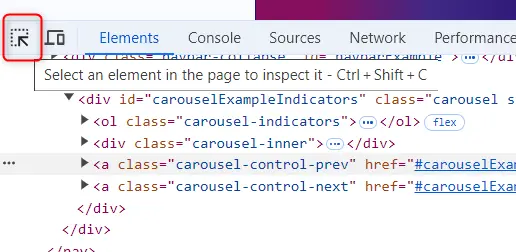
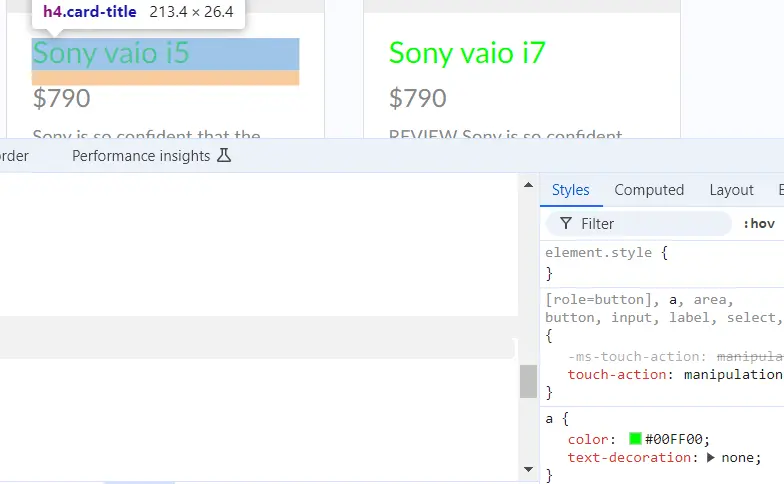
After we click on this button we can hover the mouse over any element on the page and it will highlight that element, but also at the same time it will highlight the line in HTML linked to that element. The HTML document is editable at this point and we can make changes. These changes are not persistent and they will be removed on refresh of the page. We should point out that the Elements panel is divided in two parts: first one being the one with HTML document and the second one on the right hand side which displays CSS. This CSS or Style part can also be edited. For example in the below picture I can change CSS of this link and change the color of it.
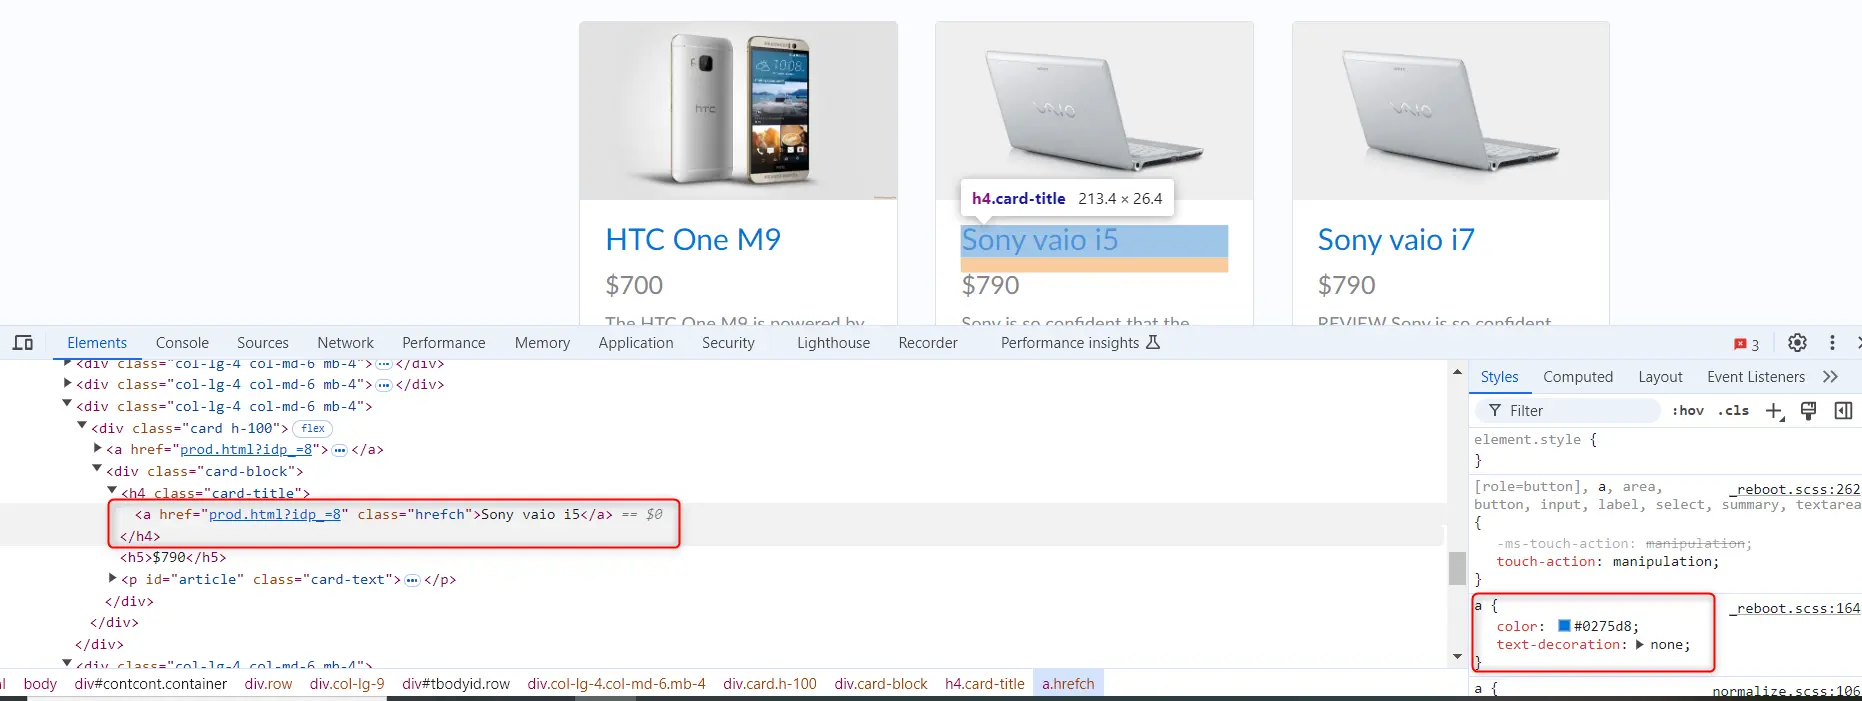
I can change the color code from #0275d8 to #00FF00 for example and I would get a green color of links. I find it particularly useful to play with CSS when there are some breaking changes in the application frontend and you need to report a bug. You can right away identify which CSS element is responsible for it.
Searching for elements
Elements panel provide us an option to search for elements. We can open search by clicking CTRL + F, or CMD + F on Mac. This search works with CSS selectors, XPath Selectors or simple text. It will show exactly how many matches are there in the document. This helps us with finding unique elements for test automation.
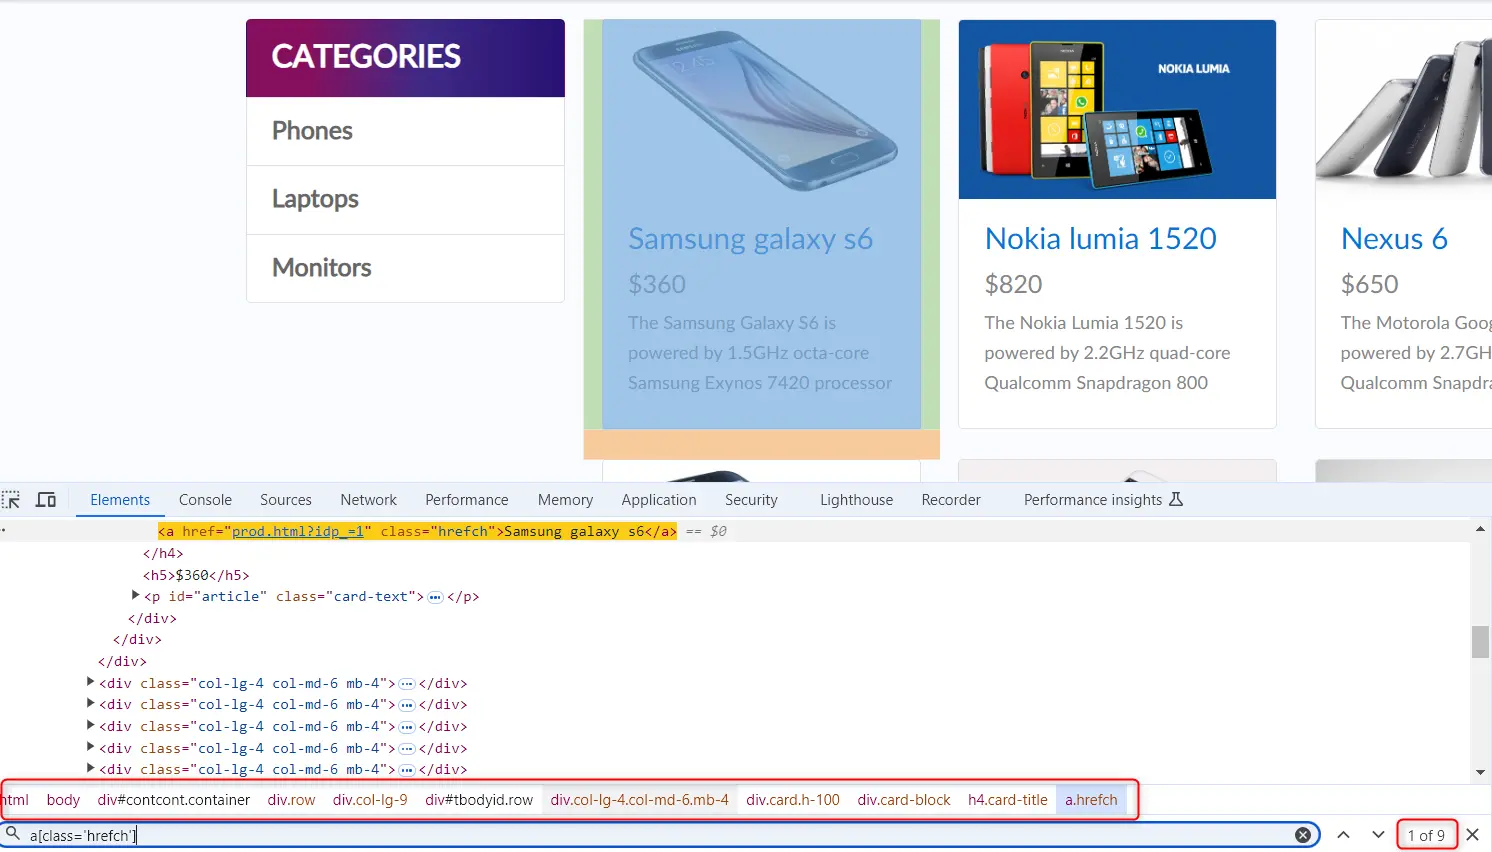
Another useful thing is this breadcrumb highlighted on the picture which can help you track back the elements from the inspected one to the very root of the document.
Context menu features
Elements panel has context menu with various options. Some of them we explained in the article about inspecting disappearing elements. We can set a breakpoint in HTML which will stop the changes in the UI when the HTML tree changes as explained in that article. Another useful possibility is to set state of the element. If we need to have this element active, we can right click on the element in HTML (not on the page itself) and select Force State option. There we can make a selection out of several options.
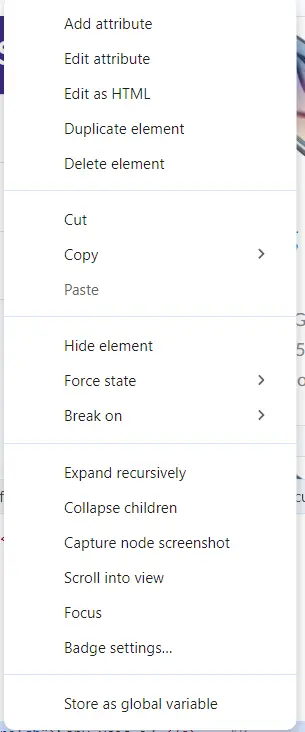
We can force scroll into view of the inspected element or we can copy XPath or CSS selector which we can use in test automation. Just click on Copy and select the option you would like from submenu. Although I would suggest a better approach, to write custom CSS and XPath selectors. You can also save some time with collapse and expand functions in context menu. It is useful when you are deep in the DOM and you need to get back to the beginning. If you need a screenshot of the highlighted element for bug reporting purposes, not a problem. Just right click on the element and select Capture Node Screenshot. It will save the image of the element on your local machine.
Conclusion
Chrome Dev Tools Elements panel is very useful for QA activities. Mastering its functionalities is crucial for effective working in QA field. Using the options as described above can save us a significant amount of time and help us improve the QA process in our team. This is just a small amount of features available in Elements panel which are the most useful for QA engineers. We will continue this series of Dev Tools features covering all the major tabs in Chrome Dev Tools showing ways how to use them the most effectively in testing and quality assurance.


