Chrome Memory Leaks: How To Find Them Using Dev Tools
In the last article of the Dev Tools for Quality assurance series I will tackle Chrome memory leak investigation in Dev Tools. Memory and Performance panels help us understand the memory usage when the application is running. Why is this important for QA engineers? I remember working on a number of client reported issues when the application is either too slow or becomes not responsive after a while. The issues like this point out to memory leaks. What is a memory leak? Memory leak is when your application uses more and more memory resources until it doesn’t have any left to allocate. In general, memory leaks are quite difficult to locate and it requires a bit of experience to find them. Memory panel helps us with identifying memory leaks so we could adequately report them.
Understanding types of memories
In programming we differentiate several types of memory. Machines do not understand the code written by programmers. This code gets converted to a language that machines can understand. Machine code is what we call this language. The machine code is stored in RAM memory of your computer.
Another type of memory is called Stack. The Stack is not that flexible and as its name says it stacks pieces of code one on top of each other. The applications usually store value type variables in Stack. When the pieces of code execute in the order they were stacked, these variables will become inaccessible. They will be removed from the Stack memory.
Third type of memory is Heap and this is a dynamic memory. It does not become filled in any specific order. Programs usually store reference type variables, static variables, async function results and class variables in Heap. In this way the program can access them from different places. Reference to the variable is in Stack but the actual variable is in Heap. When the variable life is over, the reference is removed from Stack but the variable still exists in Heap. Garbage collection is the action responsible for removing the unused variables from Heap. It checks for variables which the program doesn’t use and removes them. However, this process can slow down the loading of the page if it happens too often. All processes in the browser stop while garbage collection is in progress. Let’s see how to find memory leaks using Chrome Dev Tools.
Chrome Memory Leaks investigation with Performance Panel
When we discussed the features of Performance panel we focused on performance measurements. Yet, this panel can be used for memory testing as well. We can start the profile recording with Memory checkbox checked off and perform some actions on the page. I simply reloaded the page and started the profile recording. By pressing the broom button I can force garbage collection. The blue line in chart represents the JS Heap and ideally the level of this line should return to the same level as it was before reloading the page. Every time I press garbage collection button the blue line should drop. This is a good indicator of possible memory leaks and it is a candidate for discussion with your developers.
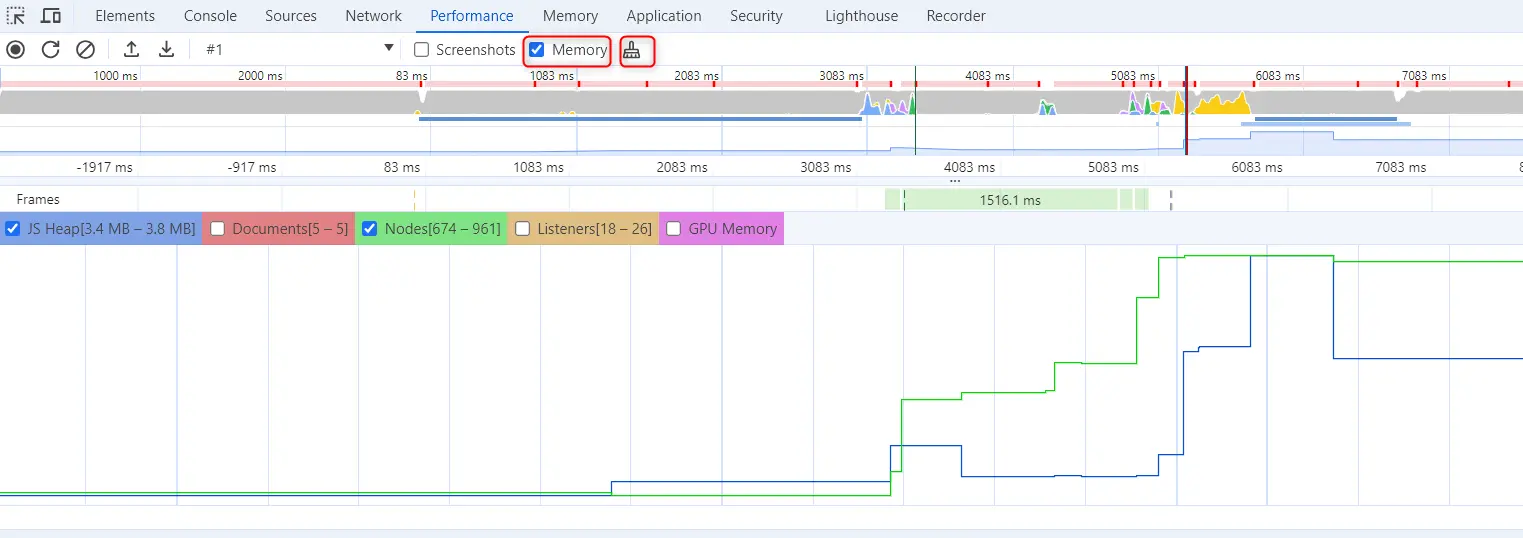
Just like this, you can start the profile, perform some actions in your application and check if there are too many of these drops for JS Heap. If that happens too often, that means that there are a lot of items in the Heap which need to be collected and destroyed. This often garbage collection can indeed stop the application from working properly.
Memory panel allocation timeline
In Memory panel we can record several profiles. We are interested in Allocation Timeline this time.
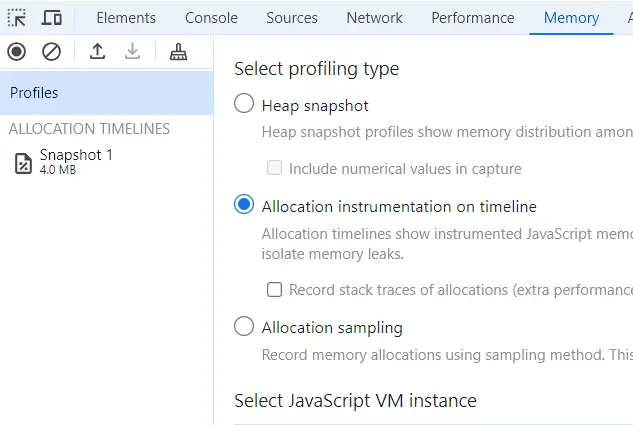
We select this type of profile and start the recording. Now, we can perform some action in the UI of our application and stop the recording. The snapshot creation is done and we can review it.
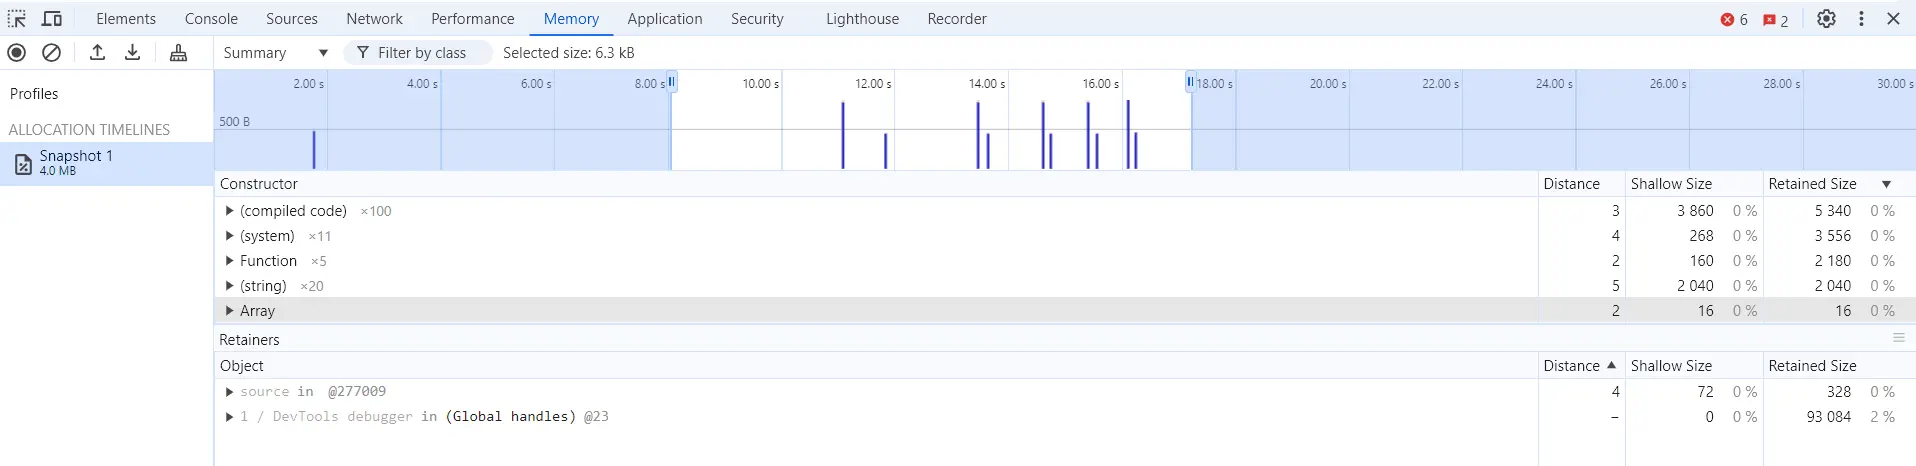
The timeline shows blue lines which represent new objects added to the memory. Blue color means that they are still active and haven’t been garbage collected. If they were disposed the line would be gray. On the right hand side of the table we can see Shallow Size and Retained Size columns. Shallow size displays how much memory this object occupies. Retained size is how much of memory is taken by this object plus other objects kept alive because of this object. As you can see on the picture you can drag and drop the borders in timeline to filter the results. Export and import of snapshots is possible as well.
Chrome Memory leaks investigation with Task Manager
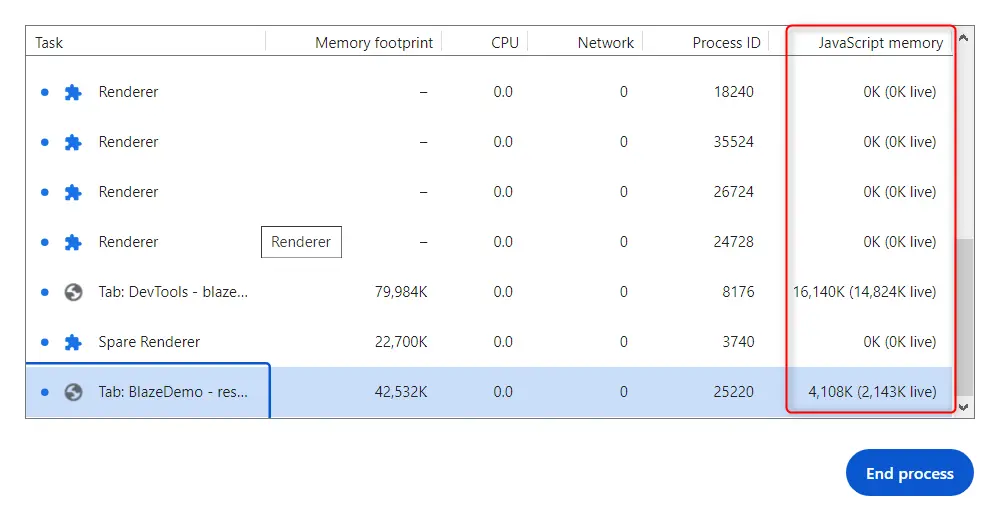
There is a third way of finding a memory issue through your Chrome browser. You can start Chrome Task Manager by clicking the three dotted menu, then select More Tools and then choose Task Manager. You will see a new window where you can add a column by right clicking anywhere and selecting JavaScript Memory. New column will appear in the Task manager window and you can follow there if the allocated memory is increasing over time. If the garbage collection doesn’t work after some time the application will become slow and unresponsive. At that point JavaScript Memory should be significantly higher than when you started the application.
Conclusion
Just like in my previous Dev Tools articles, we have seen how helpful Chrome Dev Tools can be. Chrome Dev Tools offer us a multitude of options to find memory leaks in our programs. Sometimes this is enough to locate the issue and get better idea about where to look further. We saw several useful methods about how to investigate deeper what is happening. A bug report with such investigation sure can help the developers pinpoint the exact issue faster. In addition to that it helps us understand the issue better so we could retest the fix after it was deployed.