Chrome Dev Tools: A Comprehensive Guide To The Network Panel
In my fourth article about Chrome Dev Tools, we are discussing the Network panel. We mostly use this panel for inspecting the requests and responses sent through the API. It is useful to know your way around it when you do API testing of your application. At least, when you do testing of those requests which can be triggered from the UI. Inspecting network requests is not the only purpose of this panel. We can also use it for simulation of bad network conditions. This option was useful to me in more than a few occasions. We will explain all of these possibilities and much more in the following paragraphs.
Recording Network log
The recording of network log is enabled by default and all requests coming from your browser are automatically recorded. However, there can be a lot of requests going from the browser every few seconds. In this case, stopping the recording can be a wise thing to do. When we find the request we want to focus on, we can stop the recording of any further requests. To do that, we can press shortcut CTRL + E or click on the recording icon in the top left hand side corner of Chrome Dev Tools. We can also clear the existing log if we want to start over. We do that by clicking on the delete icon next to the record icon.

On this same picture we see the filter field which we can use to filter out the requests. This filter has saved me a lot of time trying to find different requests by scrolling up and down. Also, if you try to find a correlation between requests it is very convenient. For example, I was trying to find out when some token value was generated in the Single Sign On process and the search option has helped me a lot. There are also checkboxes which allow easier filtering of requests by type. I’m interested in a request whose type is Document.

Evaluating requests
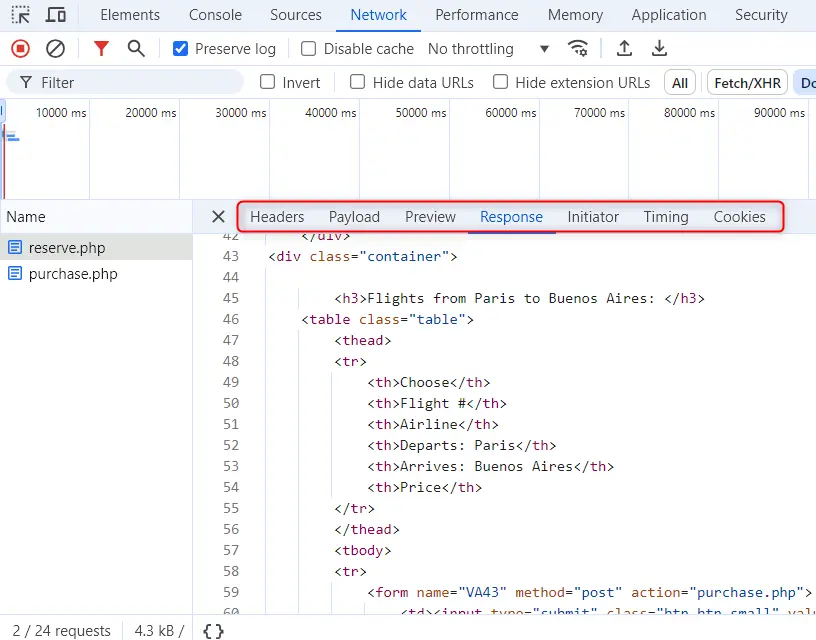
When you select a certain request you can navigate through several tabs. In these tabs you can inspect more closely headers, payload (body of the request) or response body. In this case response is an HTML page and you can view it in Preview tab.
You can also right click on the request and save the request or copy it. For some types of requests you can edit and resend them. This is quite important for security testing of APIs. For example you change something in the header and resend the request. Then you check if it would return a valid data or throw an error.
Displaying screenshots
When you refresh the page the network requests are recorded as they are sent. You can also show screenshots of the page as it is rendering. This can be helpful in situations when you debug a specific issue and you can identify the exact moment when the issue happens in the UI. To enable the screenshots, click on Gear icon on the right hand side. Select Screenshots option and reload the page. You can also filter the requests by specific time when they appeared by moving the strip in the timeline bar chart.

Configuring Throttling in Chrome Network Panel
As mentioned earlier, it is possible to create a bad internet connection to simulate specific user conditions. In my experience, there are situations when clients report some failures in the app which look like there were some issues with the internet connection. In these situations, the only thing I could do was to try to reproduce the problem with the bad connection. It worked in surprising number of occasions. Here is the visual of how you can configure it.
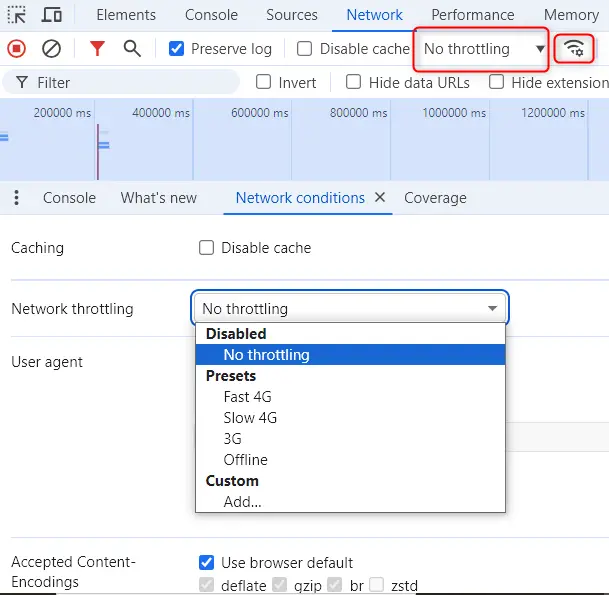
Remember to turn it off at the end of your test.
Conclusion
Whether you check responses from APIs or you would like to create custom conditions for running your application, you will find the Network panel in Chrome very useful utility for your testing efforts. It is quite easy to use once you get acquainted with its possibilities. It is also in tight connection with Console and Sources panels. The errors from Chrome Dev Tools Network panel are also shown in Console panel. Depending on the type of the request (requests of Document type), you can open the file from the response in Sources panel for further examination. As you can see, we must use the Dev Tools as a whole in order to get the best out of it.