Dev Tools Console Panel – The Best Practice For Software Testing
This is the second article in Chrome Dev Tools series. After Elements panel, we are covering the Dev Tools from perspective of Quality Assurance. In this article we will talk about harnessing the power of Console tab in Dev Tools for software testing. Console panel is the second panel in every major browser. It mainly has two purposes: executing Javascript code and logging messages. If there is an error in your application, there is a large possibility it will be logged in the Console tab. Sometimes, the Console panel will log errors you don’t see in the application User Interface (UI). For this reason it is always a good practice to check the Console panel while doing testing. You can find a problem which requires attention from developers. However, we don’t use Console just for logging the errors.
Configure Console
There are a few options you can change in the Console tab configuration. You can select the level of logging for example.

As can be seen in the picture in top left hand side there is a button which can expand the Sidebar. You can see in Sidebar how many errors, warnings, info messages you have grouped by the type of message. You can also filter the messages in Console tab.
Debugging in Console Panel
The developers can use it for testing of their code. QA Engineers also use logging when they write automation tests. Javascript can be difficult to debug and in these kinds of situations logging in Console tab can help you. You can add logger in your code to determine which part of the code is executing or to print a variable value to the Console. In Cypress, you can click on the line in Test Runner and the Console displays it which helps with debugging. Sometimes, we can take an entire line of code from some Javascript file during execution and run it in the Console. The output shows the result of that line of code.
It is very important to know that Javascript is used for various malicious attacks and you should proceed with utmost care when you run any scripts in Console. The Console will execute the script and if there is any malicious code in it, your computer might become infected. Be very careful about origin of the scripts you execute in Console tab of your browser. This is why you are warned that you are not allowed to paste the code into Console tab, although this can be overridden.
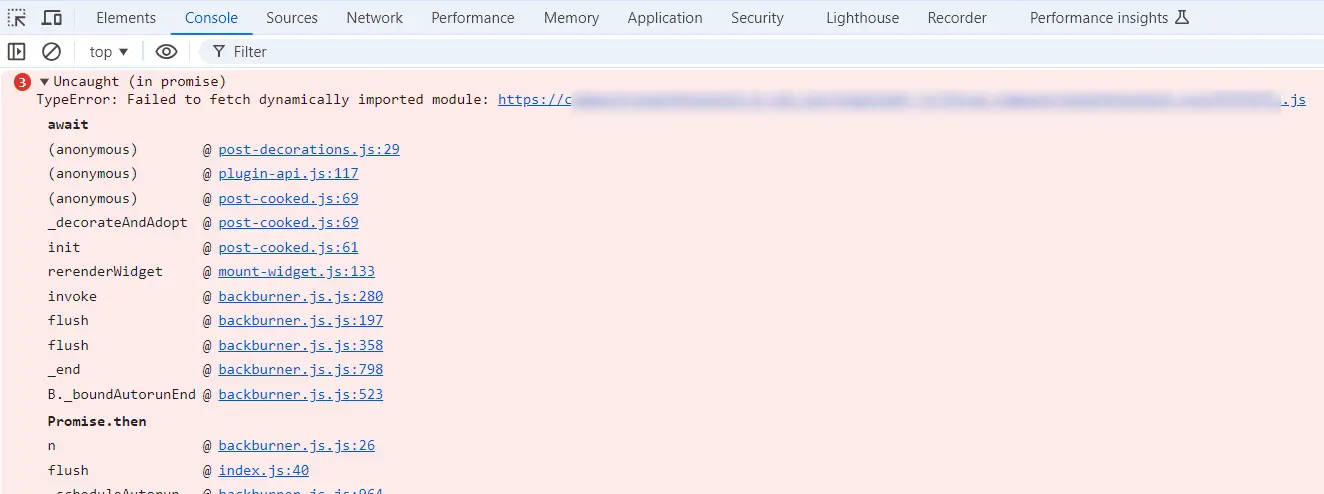
Also, in the event of an error the Console shows stack trace which can lead you to the file and line where the error originated. This can help us as QA engineers to report a bug with more details or investigate the issue further.
Evaluation of live expressions
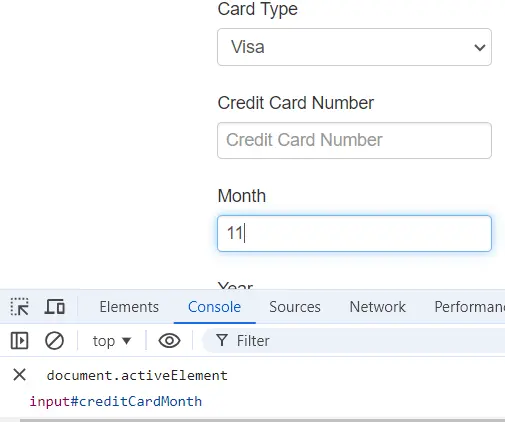
This functionality is quite useful for debugging test automation. In the past I would lose a lot time trying to find out why some test fails yet to find out the element is not in focus for example. With Evaluation of Live Expressions I can always get the active element while I do something in the application. To open the Live Expression Evaluation I need to click on the Eye icon, next to filter. Then I enter document.activeElement and press enter. It will show me the current active element, but also when I click on different elements the evaluation of this expression will change.


Showing Console drawer in Dev Tools
If we need to, we can display Console in Dev Tools along with any other tab. This simplifies moving from one tab to another for getting various information. There is an option to display Console as a drawer on top of other tabs. To do that we need to click on three-dotted menu in the top right hand side and select Show Console Drawer or simply press Escape on your keyboard.

Execute Javascript in the Console
Console is a playground for executing the Javascript code. You can use for finding elements, or checking if an element exists, setting values of an element, clicking on element. You can even evaluate Javascript expressions or even write several lines of code like a loop or function. Here is an easy example for executing Javascript.
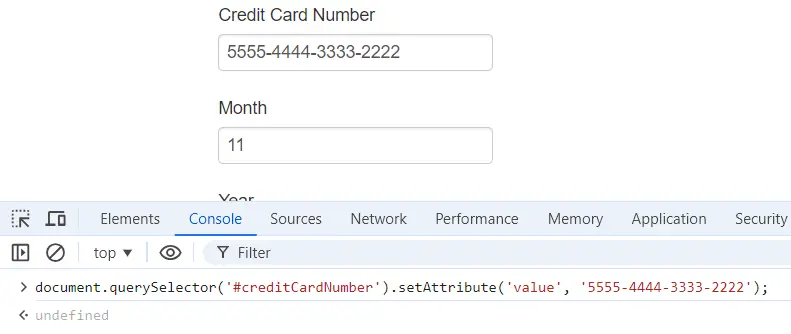
I’ve just used console to find the Credit Card Number field and populate it with a number. This functionality can be used in testing as well. You can easily write code in the console and check the allowed values in the fields. Or you can check the labels of the fields by writing a loop that collects all the labels and prints the result in Console. The possibilities are endless.