How To Audit A Web Page With Google Lighthouse And Cypress
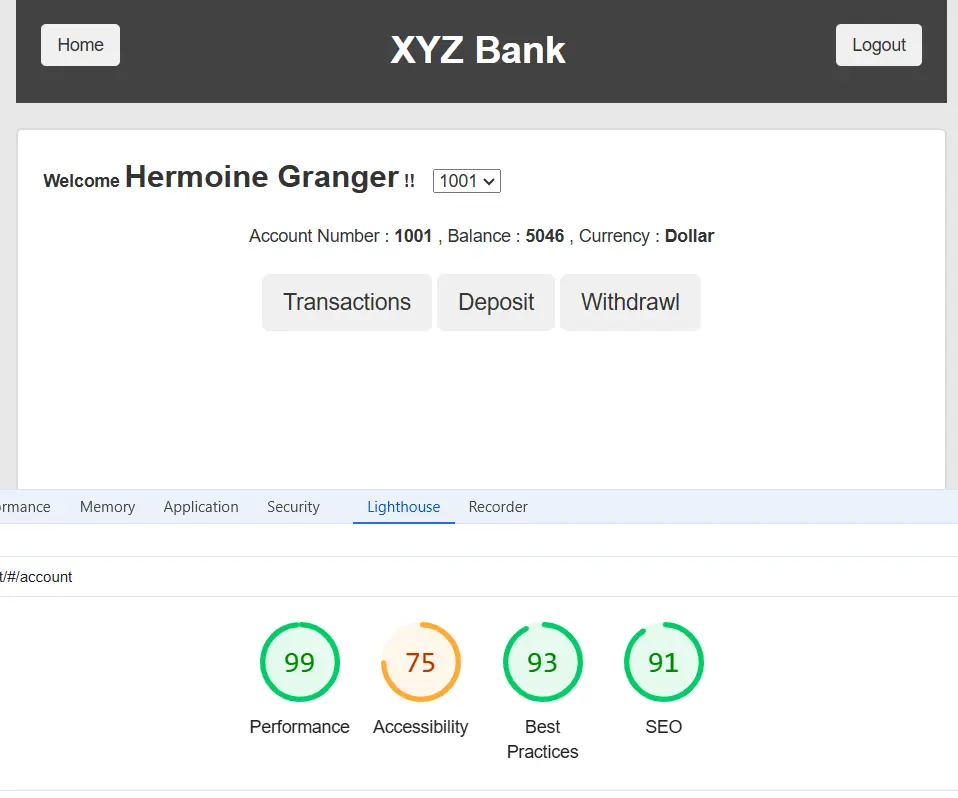
Today we are going to learn something quite useful and important in the world of web application testing. How to setup Google Lighthouse with Cypress. Cypress you all know what is it about but have you heard for Lighthouse? It is Google tool for checking client side performance, accessibility, Search Engine Optimization (SEO) and best practices on the page of the web application. You can access it from Dev Tools in Chrome browser. Let’s explain the key concepts first.
Server side vs Client side performance
There are a lot of different types of performance testing. Right now I would like to break the performance testing types into two categories: server side and client side performance.
In server side performance tests we try to find out what is the time required for server to return an information based on a request coming from our application. What would be that time required for the server to return a valid information.
In client side performance we measure the time required to display the information received from the server in the browser. This time can depend a lot on the content the server has sent. It can depend on the size of that content. Also it is dependent on CSS and Javascript used to develop the page, etc. This performance is measurable through a number of individual tests. These tests measure things like Largest Contentful Paint (LCP), First Contentful Paint (FCP), Total Blocking Time and Speed Index.
In essence these figures display what was the time needed to load the largest element on the page (LCP). When the first visible element appeared (FCP). If the application has been blocked by something before element rendering started and overall speed index of your web application.
Accessibility and SEO of the web application
We are aware that many internet users have disabilities. Websites have to meet specifically the accessibility criteria so the disabled people can use them. Lighthouse also check the compatibility with general guidelines related to accessibility.
Search Engine Optimization has goal to help your website rank higher in search results of the most popular search engines. Google has its own set of rules followed by their algorithm and following these rules set your website higher on the page. The goal is to be as higher as possible. This is because people usually check the websites displayed on the first two pages in the results.
Automated checks with Cypress
The first question is why should we bother setting up Google Lighthouse with Cypress to audit pages automatically? Lighthouse is a simple tool which performs audit of the page you tell it to audit. It cannot crawl through your web application and perform the test in each of the page. It does audit on per page basis and you have to provide the page URL for each page you want to check.
The Lighthouse integration is simplified with Cypress audit/lighthouse plugin. To install the plugin in your Cypress test suite you need to run the following commands in your terminal
npm i --save-dev @cypress-audit/lighthouse

npm i --save-dev '@cypress-audit/pa11y'
After installing the plugin we need to make some setup. According to the plugin documentation we need to make the following setup in cypress.config.js file
const { lighthouse, prepareAudit } = require("@cypress-audit/lighthouse");
const { pa11y } = require("@cypress-audit/pa11y");

e2e: {
    setupNodeEvents(on, config) {
      // implement node event listeners here
      on('task', {
        lighthouse: lighthouse(),
        pa11y: pa11y(console.log.bind(console))
      });
      on("before:browser:launch", (browser = {}, launchOptions) => {
        prepareAudit(launchOptions);
      });
    }
Another configuration needs to be completed in commands.js file because we want to chain lighthouse command of cy command.
import '@cypress-audit/lighthouse/commands';
import "@cypress-audit/pa11y/commands";
Running the test
To run the test we need just to call cy.lighthouse() function after cy.visit command in it block and the plugin will do everything. However, when we use it like this we expect the thresholds for each category to be 100 which is ideal but not plausible. To set the thresholds we can pass an object as an argument to the cy.lighthouse() function.
cy.lighthouse({
            performance: 60,
            accessibility: 90,
            'best-practices': 80,
            seo: 80,
        });
We can also select mobile test as it can be done in Lighthouse.
cy.lighthouse({
            performance: 60,
            accessibility: 90,
            'best-practices': 80,
            seo: 80,
          },
          {
            formFactor: 'mobile',
            screenEmulation: {
              disable: true
            },
          });
If we want to generate a nice HTML report we need to add another object as third parameter and the code would look like this
cy.lighthouse({
            performance: 60,
            accessibility: 90,
            'best-practices': 80,
            seo: 80,
          },
          {
            formFactor: 'mobile',
            screenEmulation: {
              disable: true
            },
          },
          {
            settings: { output: "html" },
            extends: "lighthouse:default",
          }
        );
We can clean this up a little bit and have all these objects extracted in describe block. Something like this
let thresholds = {
            performance: 60,
            accessibility: 90,
            'best-practices': 80,
            seo: 80,
          };
let lighthouseConfig = {
            formFactor: 'mobile',
            screenEmulation: {
              disable: true
            },
          };
let reportingConfig = {
            settings: { output: "html" },
            extends: "lighthouse:default",
          };

cy.lighthouse(thresholds, lighthouseConfig, reportingConfig);
Apart from this we need also to extend the cypress.config.js. The e2e block would look like this
const fs = require("fs"); //Place at the top of the file

e2e: {
    setupNodeEvents(on, config) {
      // implement node event listeners here
      on('task', {
        lighthouse: lighthouse((lighthouseReport) => {
          const reportHtml = lighthouseReport.report;
          fs.writeFileSync('lhreport.html', reportHtml);
        }),
        pa11y: pa11y(console.log.bind(console))
      });
      on("before:browser:launch", (browser = {}, launchOptions) => {
        prepareAudit(launchOptions);
      });
    }
  },
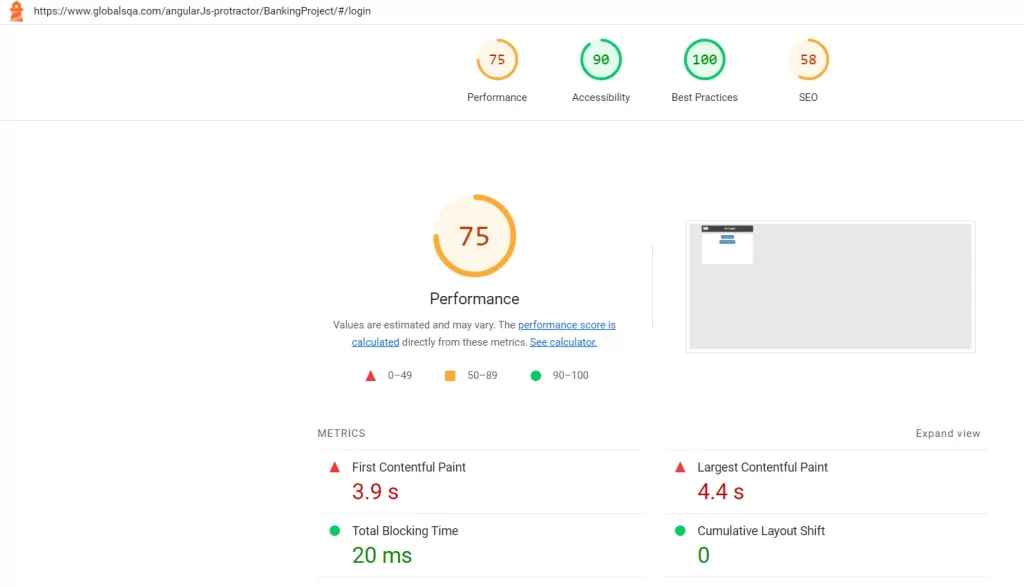
After the test the report will be generated automatically with name lhreport.html. When you open it it will show the results for the page under test.
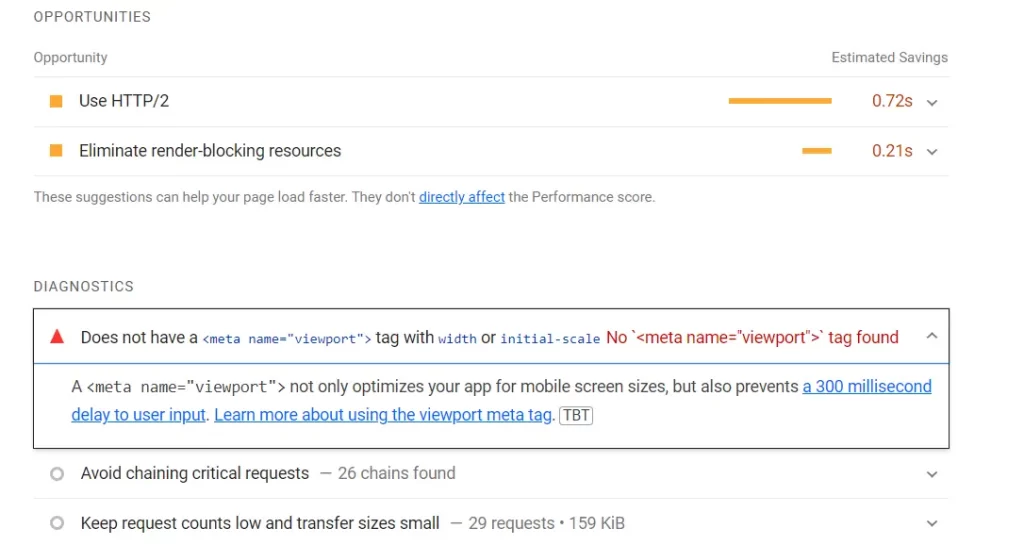
If you scroll down a little bit in this report you will see even suggestions for resolution of the issues. It basically offers you help with improving the audit results.
Final words
Cypress and Lighthouse provide as easy way to integrate performance tests into your E2E tests. Just add this simple plugin and slightly modify your tests and you will have all the information about performance of the page. You can set thresholds for values for each of the audit category and your tests will fail if the performance is not satisfying. Furthermore you will get a nice HTML report which not only shows the results but also offers resolution to the detected issues.

