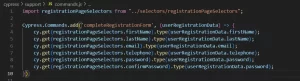
How To Debug Cypress Tests In 4 Ways With Examples
Debugging is a process of pinpointing issues in code and subsequently removing those same issues. In certain cases it is more difficult to find where is the problem than it is to write the code. Writing code seems easy if you don’t make any mistakes. Since making mistakes means being human, we can say that everyone makes mistakes in writing code. That is when good engineers thrive. They utilize a number of techniques to find the exact point of failure before they fix it. The same principles apply to writing tests in Cypress. We use Javascript and Typescript for writing Cypress tests. They tend to be a bit more complicated when it comes to debugging. Basically, Typescript is just a superset of Javascript so we need to cover debugging of Javascript files. So, how do we debug Cypress tests?
Simple Test Example
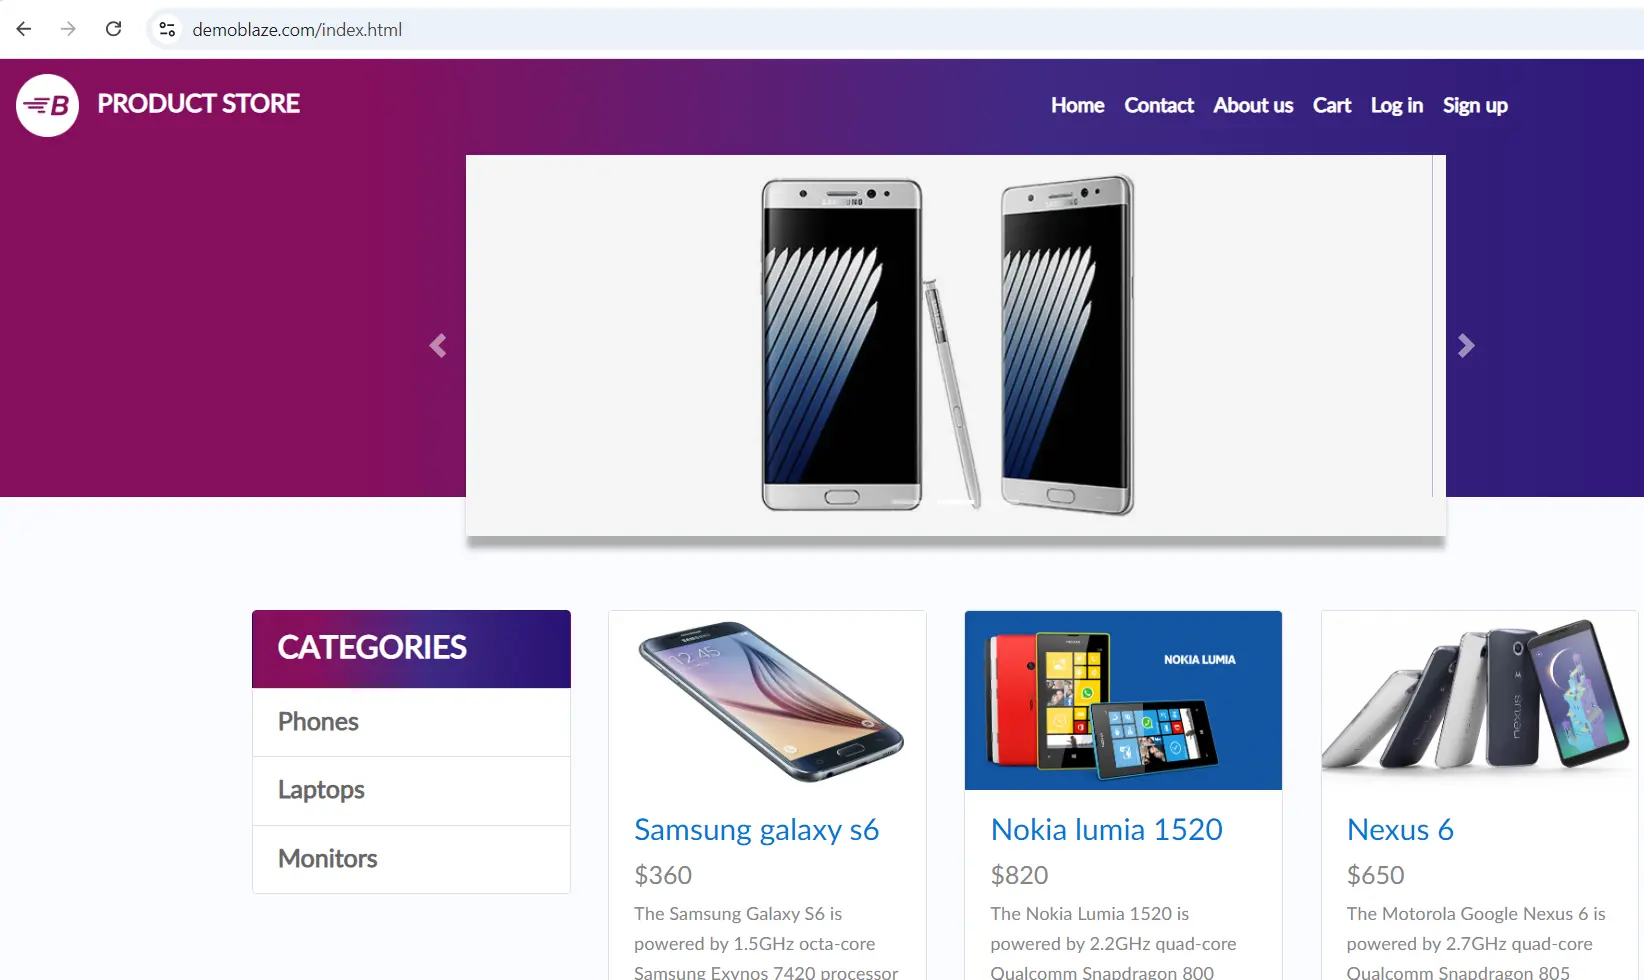
For this article I will use a simple test scenario. I visit Demo Blaze website, click on Nexus 6 link, add it to cart and check the total price in the cart.
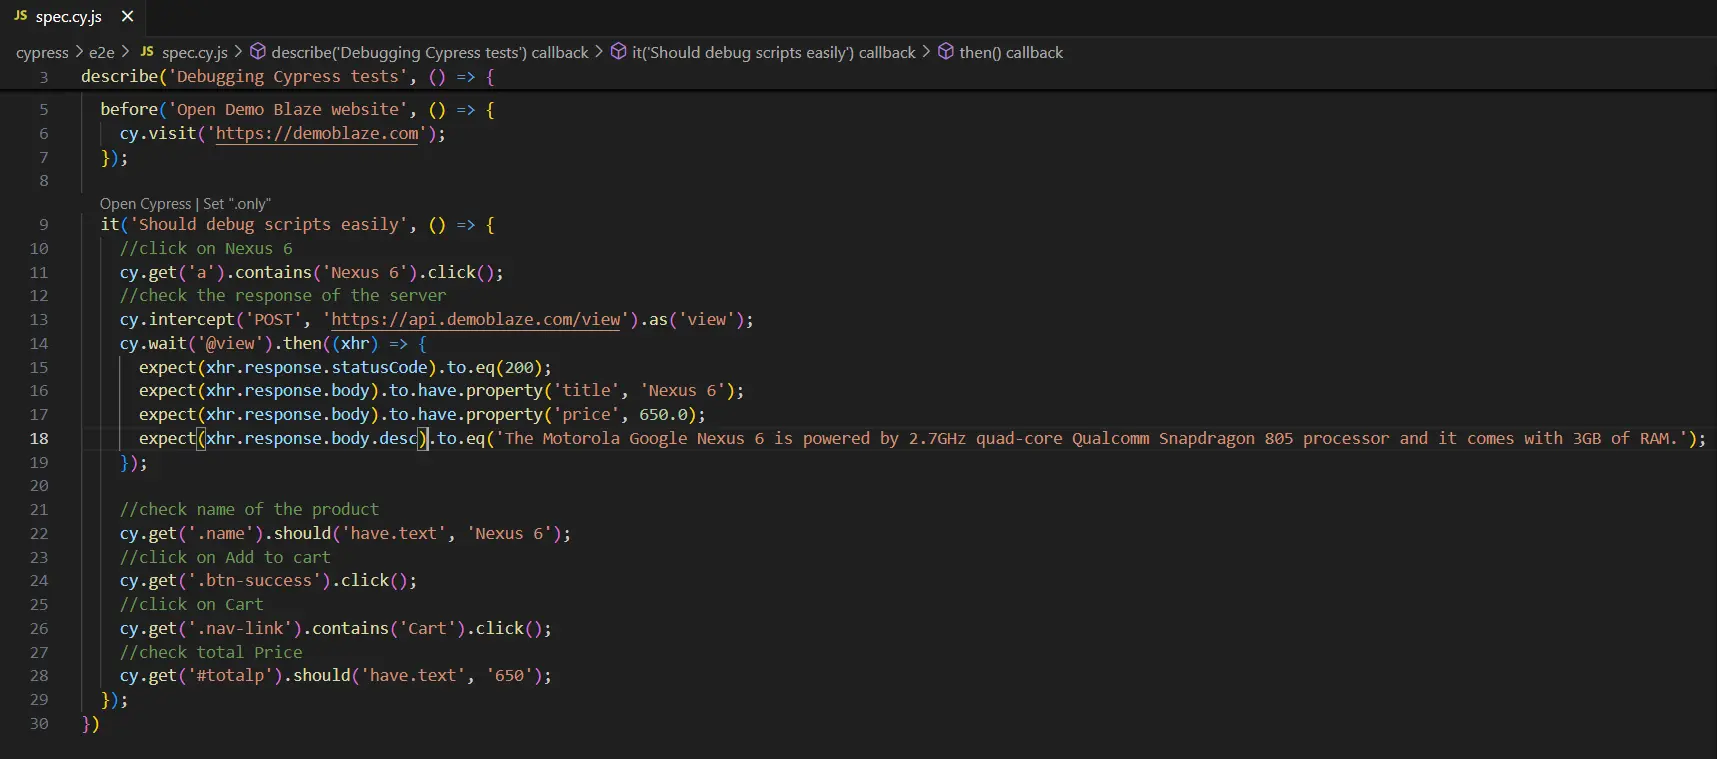
If I run the test as is, it will pass. I will make some change in the expected to make it fail and to have something to debug.
Using Cypress Runner Effectively
When we run tests in Cypress headed mode, the test is executed in Cypress Runner. We can use Cypress Runner to traverse through the actions which were performed during the execution. We can see the state before and after the action and even highlight the element on which the action was done.
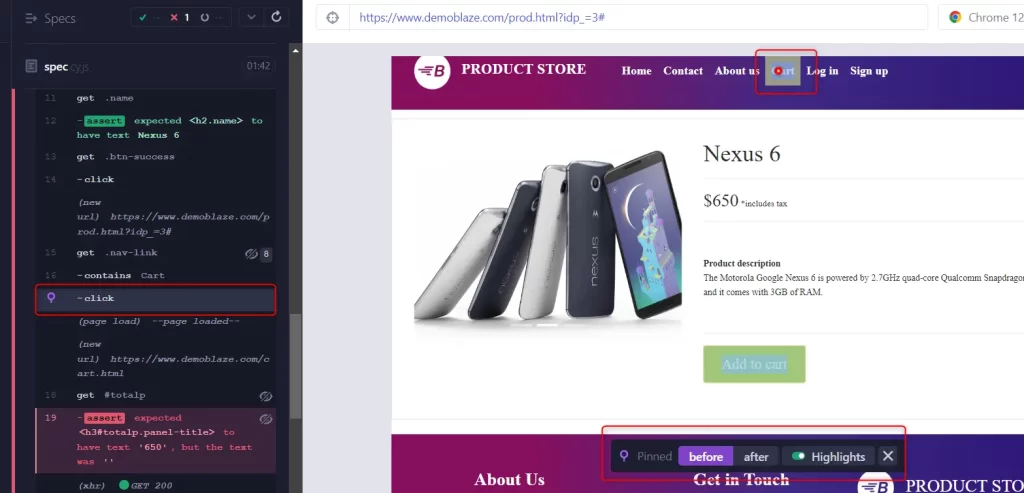
As you can see you can find the action in the left hand side pane and when you click on it the corresponding element is highlighted. You can click on Before and After buttons to see the actual state before and after the event. Another thing you can find in the runner is stack trace of the failed command.
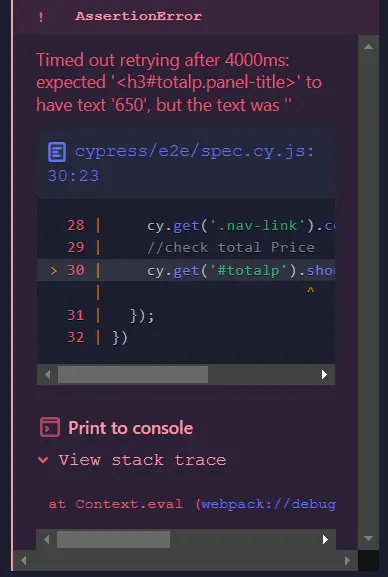
This stack trace has link that will take you to the exact line of failure in the test when you click on it.
Using Sources panel in Dev Tools
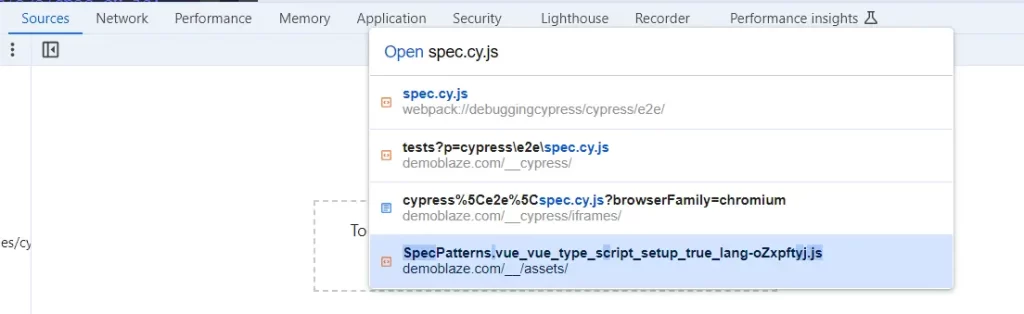
As I already wrote in one of previous articles about Sources panel, this panel is used for debugging source code in real time. If you have been using Java or C# for example you are accustomed to put a breakpoint in your code. Then you wait until the execution stops so you can evaluate some specific expression. Placing breakpoints in your code editor will not take you anywhere when you use Javascript/Typescript. However, you can put a breakpoint when you open your spec file in Sources panel. Click CTRL + P and search for your spec file.
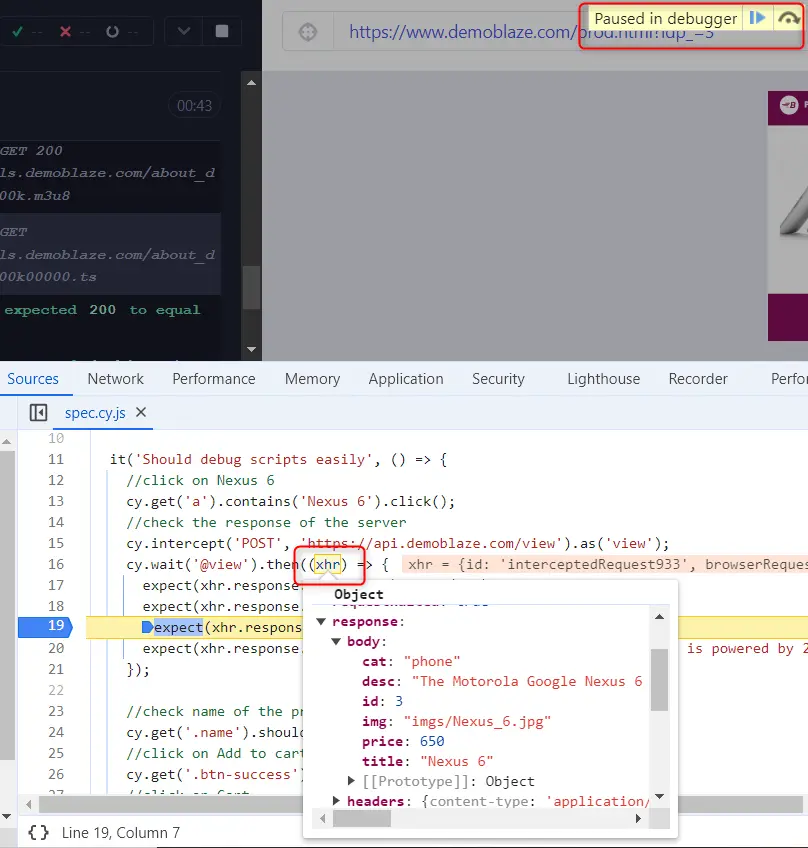
Click to open the file and then you can put a breakpoint anywhere and run your test. The Dev Tools must remain open for the breakpoint to work. Then you can inspect the value of some variable or evaluate expression in console panel. You can also move one line at a time during execution to check specific steps.
How to debug Cypress tests using cy.pause and cy.debug commands
There are a few commands Cypress offers to simplify debugging. Such commands are cy.pause and cy.debug. These commands are chainable off other commands, but they can be used standalone as well. I have added cy.debug in callback function and when I open Dev Tools the execution will stop at this point.
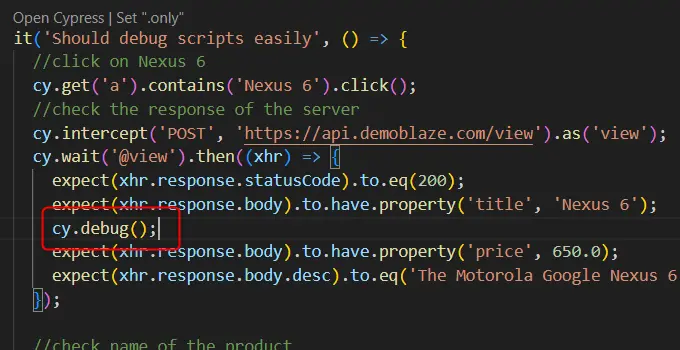
It is similar to having debugger command in the same place. Just remember that debugger command has to be always in then function while cy.debug does not have to be. The reason is enqueuing of cy commands. All cy commands are put in a queue and executed later. Since debugger command is not chained off cy it will be executed before all cy commands and debugging cannot work.
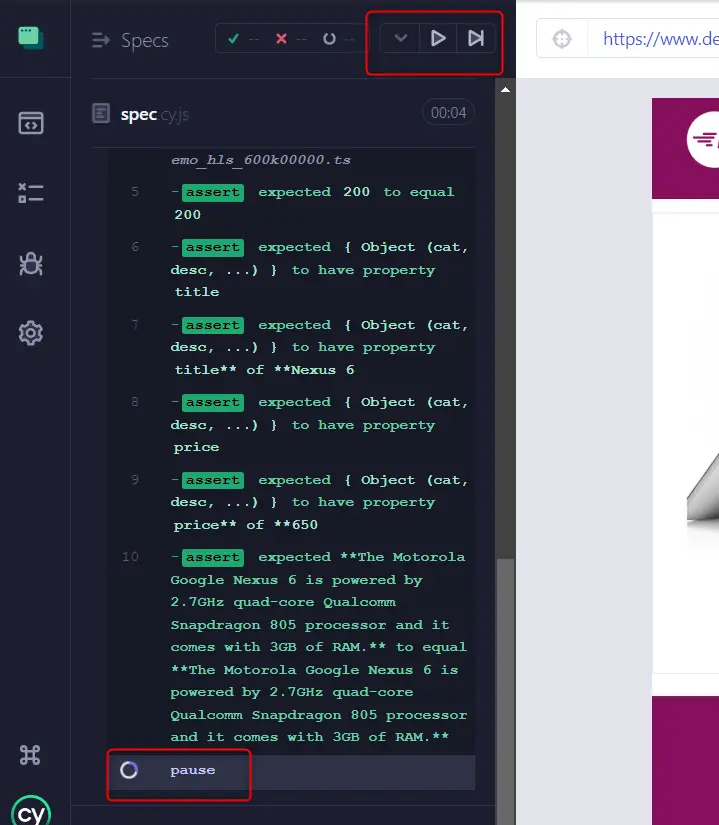
If we replace cy.debug in our code with cy.pause() we get a bit different options when this piece of code is reached. We no longer need to have Dev Tools open. The command is hit and the execution stops. Furthermore, we have play and next buttons in the left hand side pane. These buttons help us with moving through the commands one step at a time or we can continue running the test.
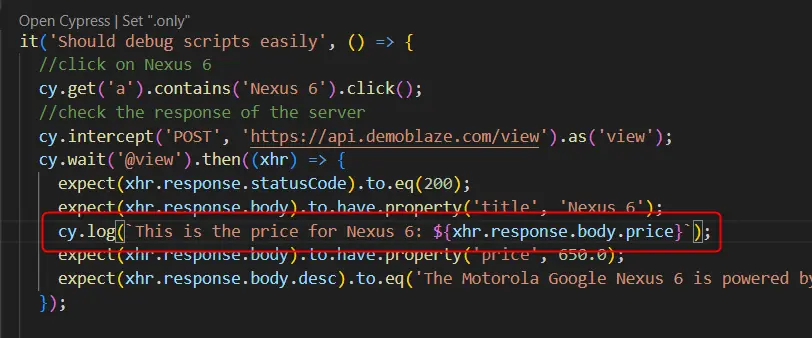
Using cy.log for debugging purposes
The fourth possibility you can use for debugging is cy.log command which can print a value to Cypress runner window. If you click on the log in Cypress runner window the same log will be printed in Console panel.
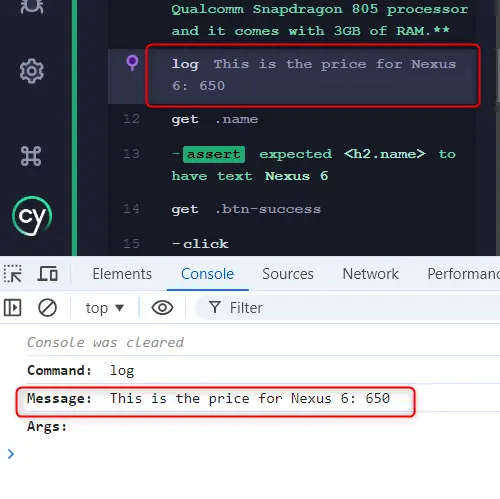
Like this you can print values of variables in case you see failed asserts and you are not sure what was the value that Cypress picked up from the UI.
Conclusion
Cypress is a great tool for end to end testing but using it with Javascript is quite challenging. The ways I described to successfully debug Cypress tests should save you a lot of time and frustration. There is a fifth way in Cypress Cloud for enterprise customers by using Test Replay but this is a different story. The 4 ways from above should give you enough space for finding out all the problems with your tests.