How To Inspect Disappearing Element In Dev Tools
I believe every QA engineer in the world faced the same problem during test automation. When inspecting of elements wasn’t possible because the element disappeared right before you wanted to inspect it. Whether those were alert messages or dropdowns or something similar, it was annoying to click the inspector and then the element goes away. Luckily there are several ways you can use in Dev Tools to stop the element from disappearing. Let’s see what options are available to inspect a disappearing element.
Breakpoints in HTML
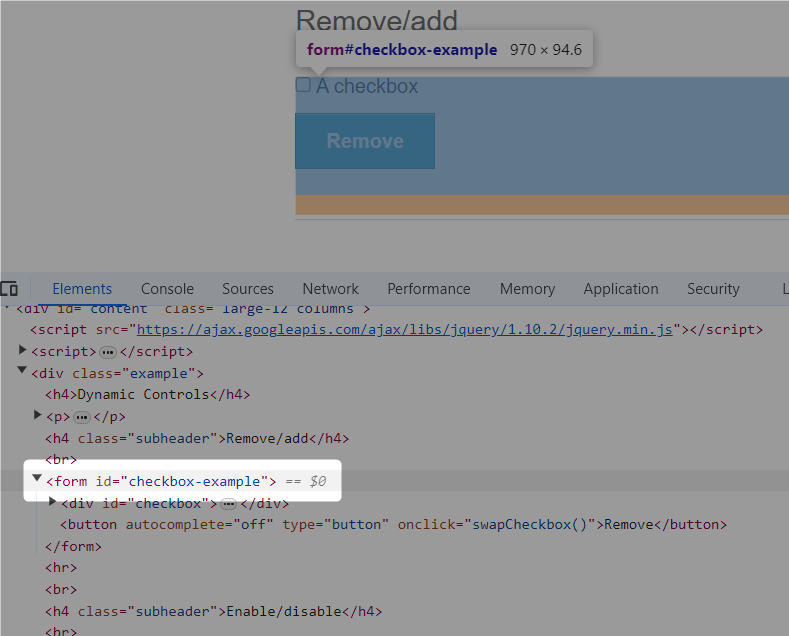
On the example page I have a Remove button which has onClick event linked to it. When I click on the button a loader appears for a few seconds and disappears. In the HTML this loader is placed in specific div element which appears and disappears when the button is clicked on.

I will use Chrome Dev Tools although all options should be also available in other browsers. First way of inspecting this element before it disappears is to put a breakpoint in HTML. But how to know where to put it? Luckily for us, Dev Tools has an option in context menu to break on subtree modifications. If we place a breakpoint on any element, this breakpoint would be hit as soon as something changes in the structure of HTML within the element with the breakpoint. In our example, all I need to do is to put a break point on any parent element above the div where this loader should appear. To do it, right click on the element where you would like to place the breakpoint and select Break on -> Subtree Modifications.

A blue breakpoint should appear next to this element. When I click on the button a debugger will appear and stop the execution of the code. At this point the loader is visible and I can inspect it.

The downsides of this method is that sometimes there are multiple subtree modifications. You have to step over some of the functions to display the correct element. Another problem may be locating a proper parent element to put a breakpoint. This method is useful for inspecting dropdown elements.
Pause the DOM with F8
There are times when you simply cannot find the parent element to put a breakpoint on. In this case it may be more useful to use the technique for pausing the DOM. To do it, we will open Dev Tools again and open Sources tab. I will click on the remove button and then press F8 on keyboard. Within a few seconds the execution of the script will hit a breakpoint, debugger will appear and I would be able to inspect the element. The DOM will be paused.

Add Debugger in Javascript snippets
Dev Tools allow us to create code snippets for frequently used scripts. We can use this ability to create a debugger snippet which will stop the DOM when we run it. To do it, we need to open Snippets in Sources tab like on the picture below:

After selecting Snippets we can create new snippet, name it appropriately and add just one thing in the body: debugger.

Now when I click on the Remove button in the UI I should right click on the debugger snippet and select Run command.

This will stop the execution of the program and we can inspect the element now. This is useful for inspecting alert messages or any element that will stay on the screen for some time after you perform some action. It might be cumbersome to use it for inspecting dropdowns.
Add setTimeout script in Console
You may know that you can write any Javascript in Dev Tools console directly and it will execute after you hit enter. You can use setTimeout function in Javascript which will execute the function passed as an argument after specified amount of time.
setTimeout(() => {debugger;}, 3000);To explain the above code, unnamed function () => {debugger;} will be executed after 3000 ms expires. This will again trigger debugger in the DOM and it would be possible to inspect the disappearing element. To do this in practice, open Console tab in Dev Tools and write this function. You can add any timeout amount in milliseconds as you like. Hit enter on the keyboard and then do whatever you need to do in the UI of the application. When the timeout expires, the debugger will stop the program and you will see your setTimeout script in Sources tab. This way of inspecting the disappearing element is particularly useful for all disappearing elements and it is quite flexible and easy to use.
Conclusion
Which ever strategy you use to inspect disappearing elements, it should save you some headaches. I hope that you will find some useful and new information in this article. If you have any other ways to inspect the disappearing element in DOM please share them in comments section.