Mastering Chrome DevTools: A Deep Dive into the Sources Panel
This is the third post in the Chrome Dev Tools Series. After Console and Elements Panel we are covering now Sources panel in Chrome Dev Tools. Why should you consider using Sources panel? I had a lot of difficulties with inspecting dynamic elements for test automation purposes. I could never make the dropdown menu persist so I can inspect it. But then I found a way to make it stay open with a little help from sources panel. We talked in great detail about inspecting disappearing elements and we will focus this article on Sources panel only. If you work on test automation using Javascript of Typescript then Sources panel can help you with debugging your code. Let’s see some examples of usage of Sources Panel.
Stopping the DOM with the help of Sources Panel
As already mentioned, one of the most frustrating things in doing test automation is to find the correct element in the HTML. If that element disappears when you try to inspect it, it makes it even worse and more frustrating. If you run into such situation, you can open Source panel, perform the action in the User Interface and press F8. This will place a breakpoint in the code and it will stop the execution. The element will stay on the screen and you will be able to inspect it.

Adding Snippets in Sources Panel
Snippets can be extremely useful if you have some Javascript code you execute often, you can add it in snippet and execute it from there. This way you don’t need to write the code all over again every time.

To do this, you need to click on the arrows menu and select Snippets. Then click on New snippet and enter your code in the editor. Save the code and then when you want to run it, you can either right click on the snippet and select run, or you can use shortcut CTRL + Enter.
Debugging Javascript code
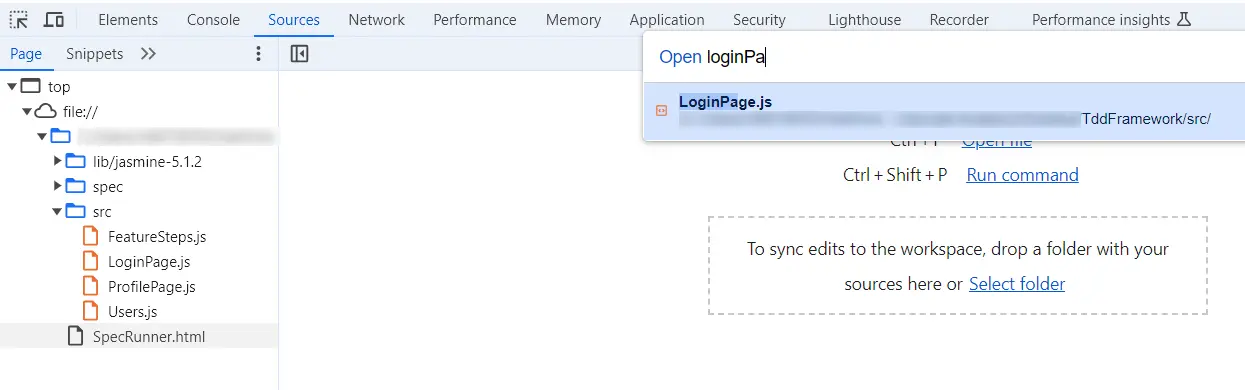
Sources panel will load all your test files when the execution of the test starts. If you run your automation tests with Javascript or Typescript you can place a breakpoint in you Sources panel and the execution will stop. You can evaluate your code then. I have a simple TDD project here which I run in Karma test runner. All my Javascript files are loaded and shown in Sources panel. I can open any of them by finding them in the left hand side pane. Another way of finding them is to press CTRL + P and enter the name of the file.
When I open the file I just need to place a breakpoint at any line where I would like to evaluate the expression.

When the execution hits the breakpoint you can step over (press F10) or into the function (F11), or you can continue execution (F8).
Final Words
Sources panel in Chrome Dev Tools is an amazing utility which helps us with everyday activities like test automation or even manual testing. This type of debugging is specifically useful for evaluating objects and arrays. It has helped me on numerous occasions to understand why some assert in my tests fail. It is especially useful for evaluation of deep comparison of two objects. To fully utilize it we should be using it in combination with Console and Elements panel.