Performance Testing Simplified With Chrome Dev Tools
In today’s article we are covering a very important subject, performance of web applications. Did you know that you can measure performance in your browser by opening Chrome Dev Tools? There are specifically two panels in Google Chrome which can help you with getting insights about performance of your website. One of them is Performance Panel and the other is Lighthouse. Today we will analyze in great detail Performance panel. We will see how we as Quality assurance engineers can use it for testing. Testing of performance of web application or website is part of non-functional testing. In modern software development it is vital to follow the performance best practice. Otherwise you may end up with an application no one would like to use. How can we make sure that the application is following the best practice?
Initialization of Performance Panel
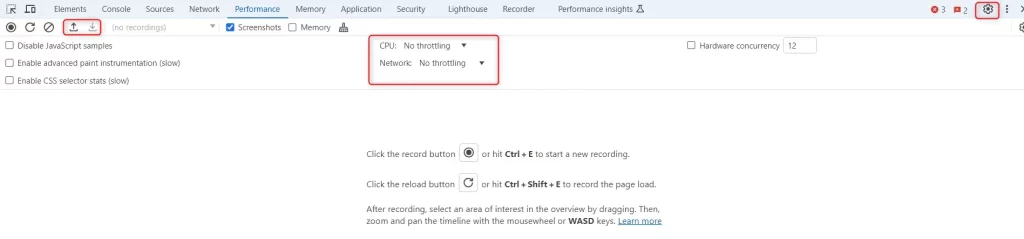
When we first open the Performance panel it shows us very little information. Just a few instructions on how to start a new recording. What is a recording? Performance panel records the times required for sending the request from browser to web server and back to the browser. Just like we explained in Client/Server model. In addition to recording that time, it also records the time required to render (to display) the elements on the page. During this recording, the Performance Panel will record screenshots of the web page so you can easier analyze the results. All of this together is called a Profile. Now, when we know what is a recording, how do we actually start it?
Starting Recording
There are two ways to start a recording. You can click record button in top left hand side corner or press the reload button to reload the page and start the recording. If you are interested in performance of a single page, then the second option for starting recording is what I would suggest. There are also keyboard shortcuts CTRL + E and CTRL + SHIFT + E for recording start and reload of the page respectively.
Additional functionalities
For testing purposes, there are additional functionalities where you can add some obstacles for your web page. As we discussed in the article about Network Panel here is also possible to add throttling. This time it’s not just that we can add Network throttling, but also CPU throttling. To explain additionally, throttling is a simulation of bad conditions which can influence the loading times of the page. In Chrome Dev Tools Performance panel we can simulate bad network or bad CPU.
Another great thing is that you can save the profile on your computer and reload it later if you need to compare the performance over time.
Running the performance check
Let’s start a recording by reloading the page. When the recording is over, the page will show results. The entire load flow is shown as a waterfall and substantiated with screenshots. The screenshots are enlarged as you hover over the part of the timeline. You can isolate one part of the recording by using mouse scroll or by dragging the left and right boundary as shown in the picture.
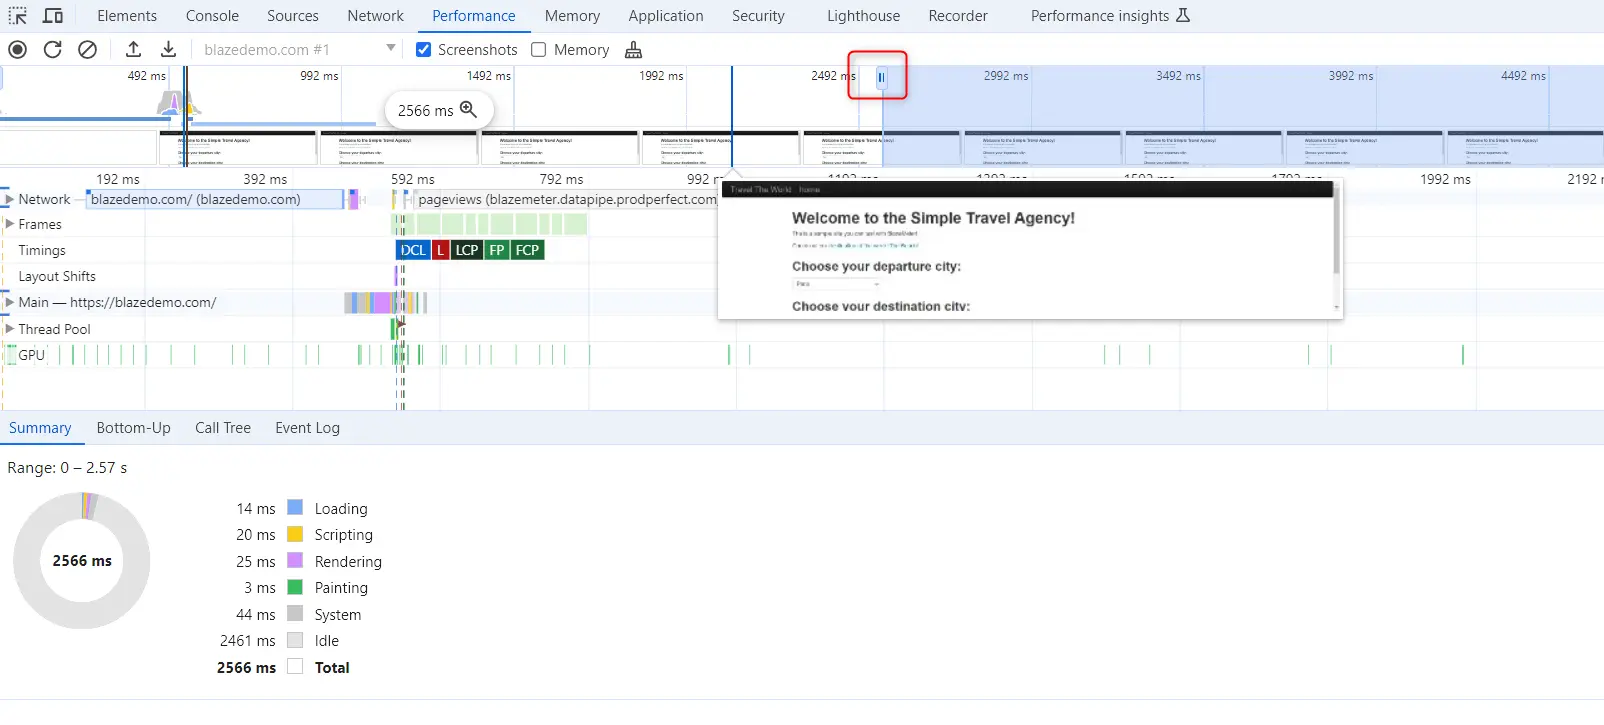
The lower part shows a breakdown of all groups of actions which tool place during loading. If you expand the Network part you will see a request sent to the server and the response times for it.
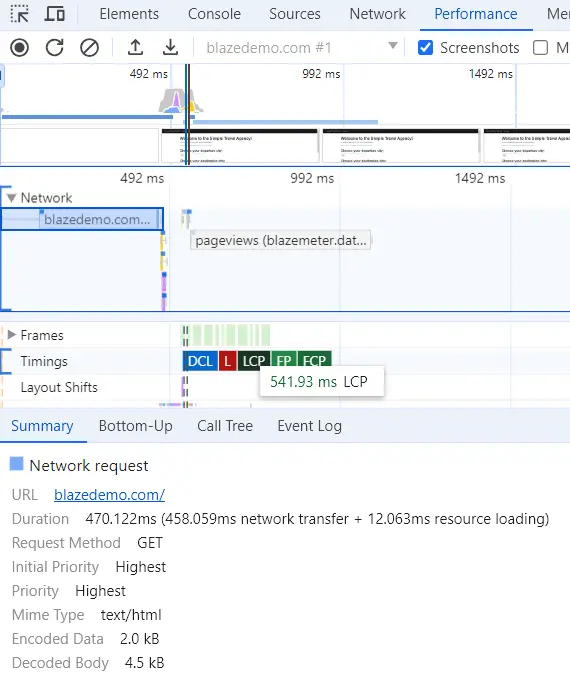
Another important part to know, if you are testing the performance of a website is to know the Largest Contentful Paint (LCP), First Paint (FP) and DOM Complete Load (DCL). If you hover your mouse over these icons, you will see the exact value.
Comparing different profiles
Testing of performance is useless if you don’t know what you aim for performance wise. If you find a slow loading page, you will report the issue to developers. They will hopefully fix it and then your job as a QA engineer is to test it again. How can you know if there is an improvement? Performance panel allows you to compare several profiles and see the loading times for the page. This is not in-detail comparison but it can give you some idea if there is a change after the fix or not.
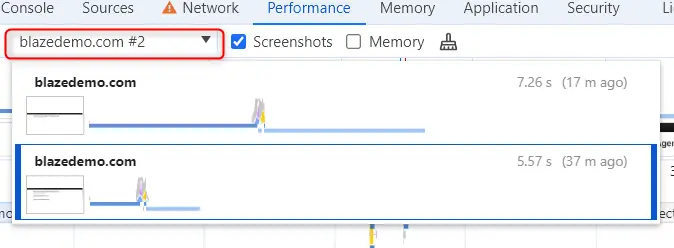
I’ve made here two profiles. The below one is made without any throttling and the top one is with Network throttling. The above one is slower as shown. We can go in deeper analysis of the slower recording to check which parts were slower. Was it the network part, where the request took more time to get the information from web server? Was it the rendering of the page or something else?
Conclusion
Performance testing is among the most important non-functional tests we must take in software development process. There are various ways of performing the tests to check the loading times but usually they require setup of additional tools. This require time and expertise in the performance testing domain. The Chrome Dev Tools Performance panel in provides just enough information to understand if there are bottlenecks on your web pages. It may not provide as much detail as dedicated performance testing tools, but it will give you a unique insight about performance of your application. In some cases this may not be enough, but for a large part of development community this will be just enough.